English Drills
Home › Teacher Lessons › Grade/Year 7 & 8 English lessons › Reading Data from a Graph

Reading Data from a Graph

Maths data language for a Grade/Year 7 or 8 classroom, with reading, subject language, speaking and writing.

Grade/Year 7 & 845–60 minutesPrintable
Teacher lesson: Read the short text aloud and model the first task. Students can plan in a language they know well before speaking or writing in English. Use all twelve panels or adjust the pace for your learners.
Teacher AnswersBack to Teacher Lessons
1Reading
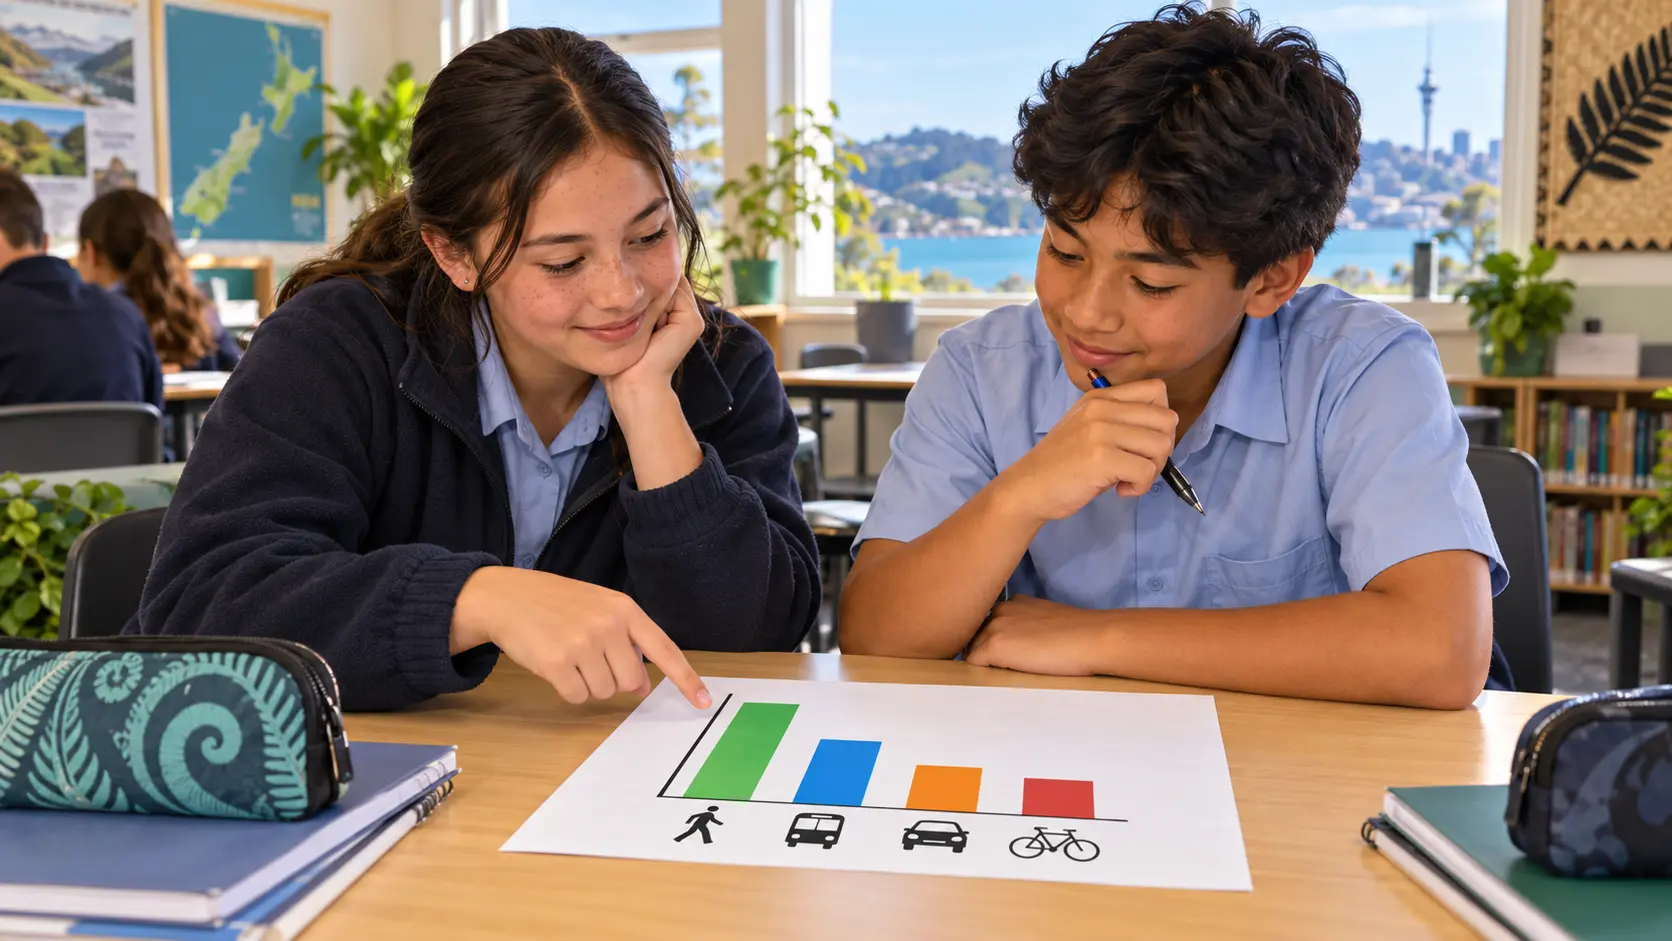
Two students compare a bar graph about ways to travel to school
Illustration: Reading a bar graph.
Before you read:

Look at the title. What do you know about maths data language? Tell a partner one idea.

A Year 7 class asks students how they travel to school. Twelve students walk, eight take a bus, six arrive by car and four cycle. The class draws a bar graph with a separate bar for each method. The vertical axis shows the number of students. Walking has the tallest bar and cycling has the shortest. The teacher reminds students to label both axes and give the graph a title. Students use the data to write comparisons rather than guessing what happens at every school.
2Vocabulary
Words: bar graph · axis · comparison

Write a short meaning or example. You may use a language you know well first.

bar graph –
axis –
comparison –
3Comprehension

1. How many students walk?

2. Which is the least common method?

3. How many more walk than take the bus?

4. What should the graph include?

4Language Focus

Use these sentence starters. Change the words to fit your idea.

students , while students .
There are more students who .

Write one sentence of your own.

5Listen and Note

Listen as your teacher reads the text again. Note two key ideas or facts.

First idea:

Second idea:

Compare your notes with a partner.

6Speaking

Compare two travel methods using “more than” and “fewer than”.

Use a sentence starter from panel 4. Ask your partner one follow-up question.

Useful questions: “Could you explain that?” “Why do you think so?”

7Try It

Use this skill: How might you use maths data language in another lesson or everyday situation? Give one example and explain it to a partner.

Draw a quick plan or write three key words before you speak.

8Writing

Write three sentences about the data, including one difference and the total number surveyed.

Plan in a language you know well if it helps. Then write your answer in English.

9Word Study

Choose the correct words from this lesson’s reading.

Word bank: axis · comparison

A bar graph uses each to show an amount. Make a between two bars.

10Sentence Builder

Put these words in the right order. Check the capital letter and punctuation.

walk / than / Four more students / take the bus / .
11School English

Your partner reads the graph differently. Ask which bar they used.

Write a polite question or response you could use at school. Then say it to a partner.

12Exit Reflection ✓

Take a few minutes to reflect.

1. One useful word I learnt in this lesson:

2. One thing I can do in class:

3. One question I still have: